Results of the NCAVES pilot ecosystem accounts for Karnataka released
As part of the NCAVES project, in parallel to the development of national level ecosystem accounts, a detailed and comprehensive set of ecosystem extent, condition and ecosystem services accounts have been piloted in India at the subnational level for the State of Karnataka. The accounts have also been applied in subsequent scenario analysis, assessing conservation and afforestation policies. This work was led by the Energy & Wetlands Research Group at Center of Ecological Science of the Indian Institute of Science in Bangalore, in collaboration with scientists and researchers from IIT Kharagpur, the Indian Ministry of Environment, Forests and Climate Change (MoEFCC) and the National Statistical Office (NSO), Ministry of Statistics and Programme Implementation (MoSPI), Government of India.
The state of Karnataka was selected for the pilot in 2018 due to its good data availability, strong technical capacity within local research institutes, and policy interest in using an accounting approach.
Figure 1. Land use dynamics in Karnataka state.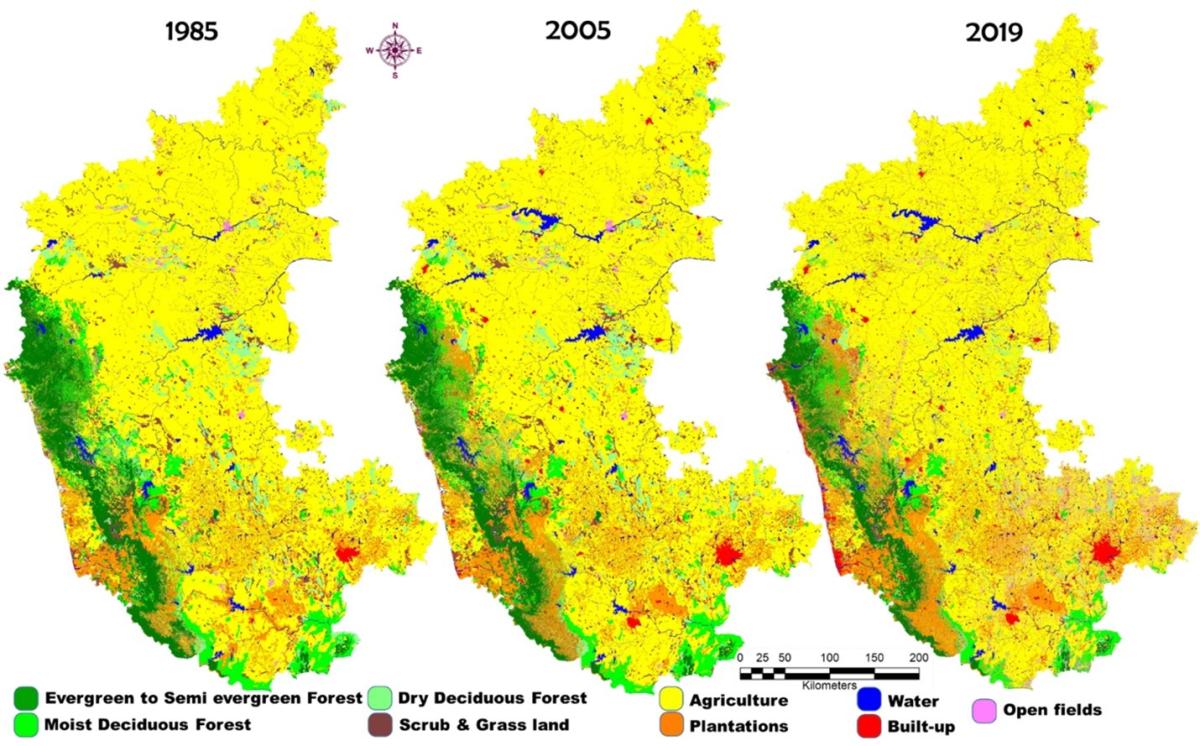
The ecosystem extent accounts were compiled based on temporal remote sensing data, using supervised classification and validation through field collected data. Accounts - both net balance and change matrixes - were compiled for 10 individual districts, chosen to represent the various agro-climatic zones, as well as for Karnataka state as a whole.
The results show that from 1985 to 2019 the built-up area in Karnataka increased from 0.5% to 3%, horticulture areas increased from 8.8% to 11.1%, while natural forests showed a decline in extent (evergreen forests from 7.5% to 5.7%; moist deciduous forests from 5.7% to 4.1% and dry deciduous forests from 4.0% to 2.2 %). New urban agglomerations were noticed across the cities and major towns such as Bangalore, Mangalore, Hubli, Hassan, Mysore, etc. Large-scale monoculture plantations of Eucalyptus, Rubber, Acacia, Teak, and Areca nut have increased and now cover 12% of the state. Some districts such as Uttara Kannada experienced a decrease in forest cover from 68 % as of 1973 to 29% in 2018.
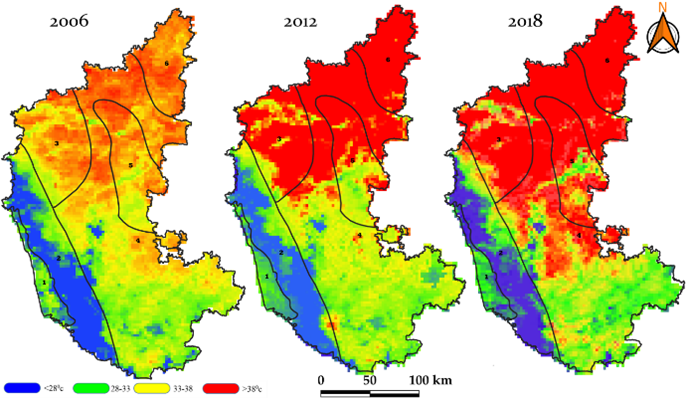
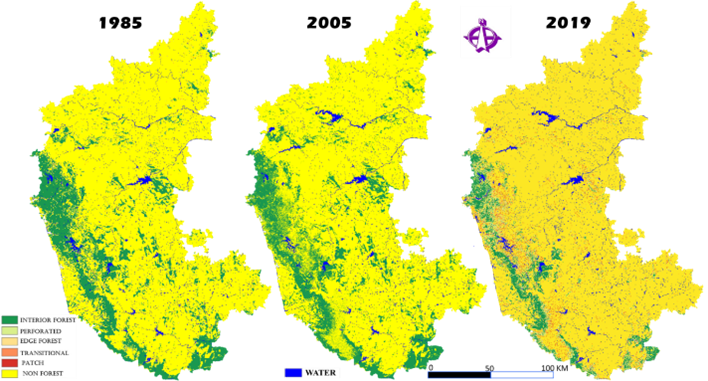
For the condition accounts, the SEEA EA Ecosystem Condition Typology was followed, distinguishing between abiotic, biotic and landscape level indicators. The condition accounts were compiled for around 20 different variables including: multiple soil characteristics such as organic carbon, nitrogen, pH; the status of flora and fauna in terms of endangered species; structural state variables such as above and belowground biomass; net primary productivity as key measure for functional status; and land surface temperature and forest fragmentation to measure landscape level status. Each of these variables were assessed using spatial data and models as illustrated in Figure 2, showing the increase in average surface temperature and in forest fragmentation.
Figure 2. Land surface temparature (2006-2018) [L] and Forest fragmentation (1985-2019) [R}
The results of all variables were integrated in condition accounts for each of the 30 districts, choosing appropriate weights. The composite condition index for Uttara Kannada (Table 1) for instance shows a decrease in the extent of ecosystems with high condition from 40% to 26% between 2005 and 2020. These changes in condition were driven by habitat loss, overexploitation, invasive species and pollution.
Table 1. Condition accounts of Uttara Kannada (2005-2020) 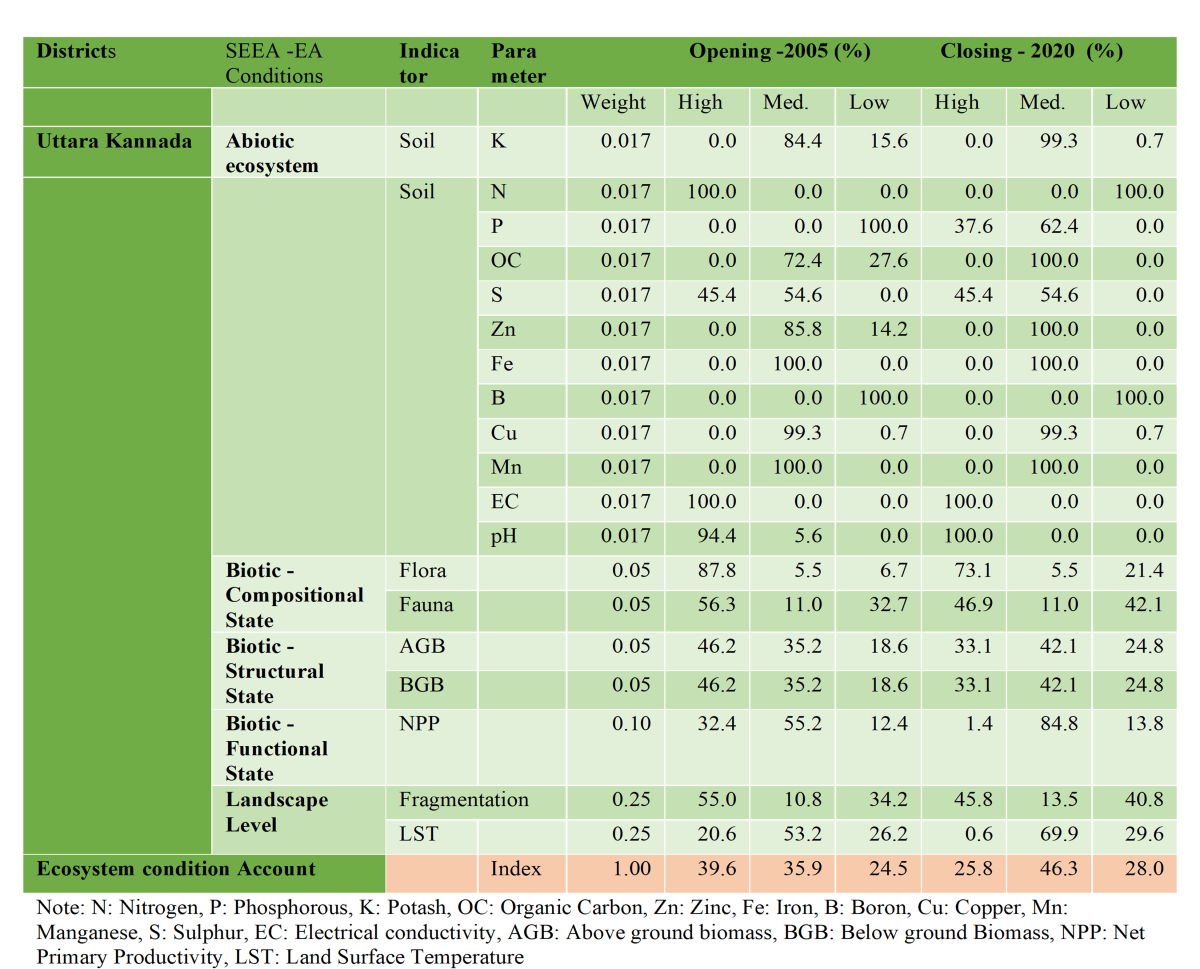
The ecosystem services accounts were compiled for virtually all ecosystem services distinguished in the SEEA EA reference list, in physical and monetary units for forest and cropland/horticulture ecosystem types, based on field survey data and data collected from agencies. The provisioning services were valued based on the residual value method, while regulating and cultural services were valued using various methods including travel cost and benefit transfer approaches. The results were aggregated in a total ecosystem supply indicator (TESV) or gross ecosystem product, for the years 2005 and 2019, and used to calculate monetary ecosystem asset values (see Figure 3).
Figure 3: District level TESV disaggregated by ecosystem service type.
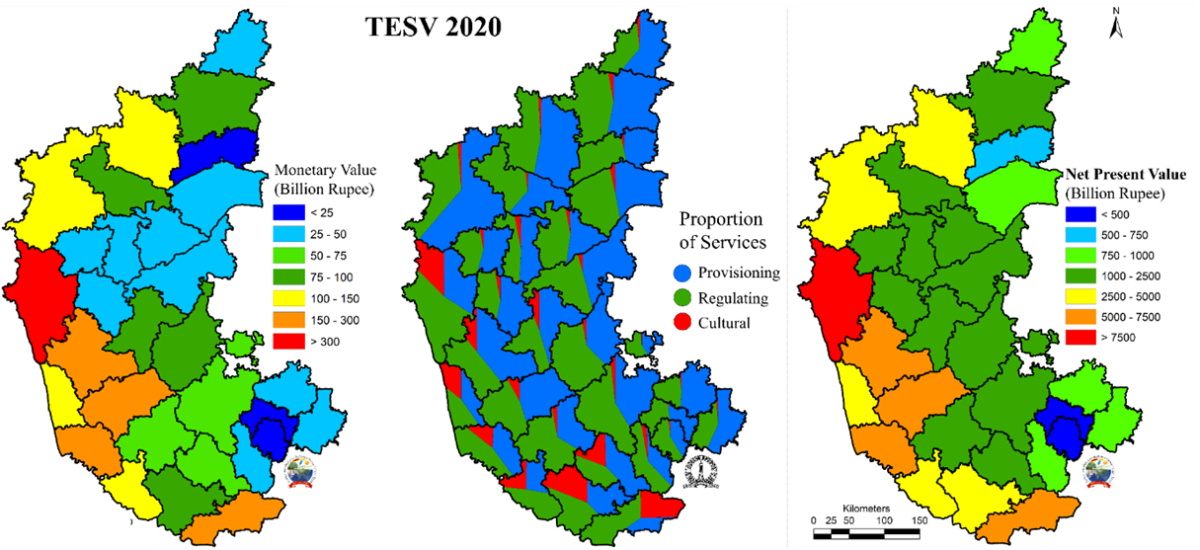
The TESV of ecosystems was 3,620 billion INR (Indian Rupee) in 2005 (forest ecosystem: 2,841 billion INR and agriculture ecosystem: 779 billion INR). However, the TESV computed for 2019 indicates 2,793 billion INR (forest ecosystem: 1,835 billion INR and agriculture 958 billion INR). While the TESV for agricultural ecosystems increased, there was a much larger decrease in TESV for forest ecosystems. This 35.4% reduction can be attributed to the degradation of ecosystems seen in the extent and condition accounts.
Figure 4: Ratio of total ecosystem services supply with GDDP.
The relationship between the SEEA EA and the System of National Accounts also means that TESV can be compared to GDP. The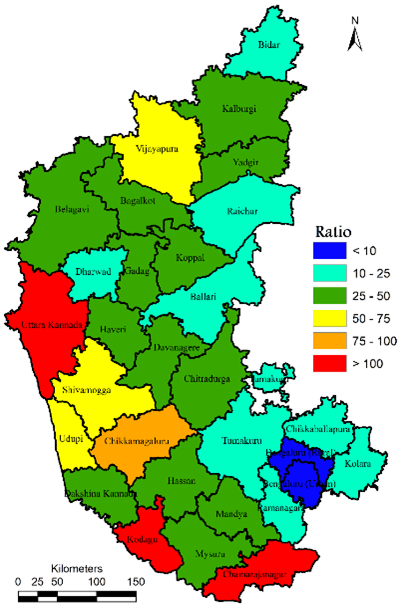 GDP of Karnataka is about 10,128 billion rupees. Therefore, the TESV of the forest ecosystem is equivalent to 18.1% of the GDP, and TESV from agriculture is equivalent to about 10.6% of GDP in Karnataka. Subsequently, for each of the districts TESV is compared with district level GDP (GDDP), showing that in a few forest-rich Western Ghats districts (mainly Uttara Kannada, Kodagu, and Chamarajanagar) TESV that is actually higher than GDDP.
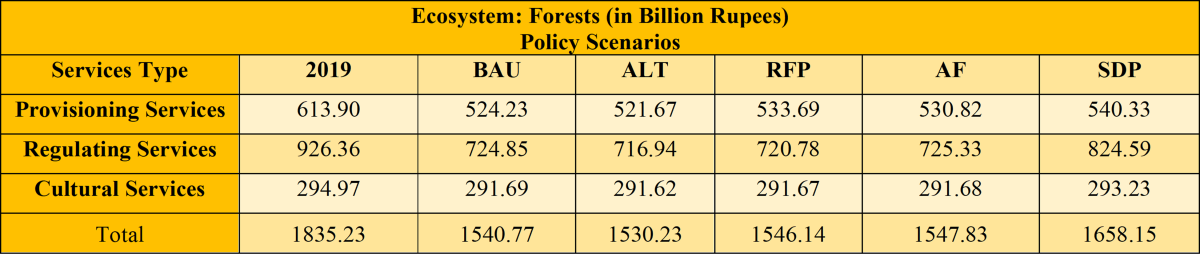
Finally, the accounts were applied in policy scenario analysis, assessing first of all the likely business-as usual (BAU) scenario in 2033 extrapolating current trends in land use using agent-based modelling techniques. The BAU was compared with 3 policy scenarios: agent-based LU transition scenario - ALT; reserve forest protection scenario - RFP; afforestation - AF; and a sustainable development scenario - combining scenarios 2 and 3 - SDP.
Subsequently, the impacts on forest-generated ecosystem services were assessed in these various scenarios compared to the BAU (Table 2). The analysis finds that while the value of ecosystem services declines in all scenarios, the sustainable development scenario seems to be the most prudent scenario to be implemented, leading to an increase in services compared to the BAU. This scenario ensures the protection of reserve forests and afforestation of degraded areas but allows economic growth in regions other than forest areas.
Table 2::TESV of forest ecosystems in Karnataka considering various policy scenarios.
The study concludes that forest resources in Karnataka State have undergone tremendous change and degradation because their value is oftentimes poorly understood and therefore not sufficiently considered in the policy-making process. The study provides various policy recommendations how the accounts and subsequent analysis can inform afforestation policies and help achieve targets formulated under (sub)national forest policies such as the 10-year Green India Mission.
The ecosystem accounting pilot has demonstrated the feasibility of ecosystem accounts compilation at the Indian state level, and the usefulness of the accounting framework in integrating various data sources and thereby inform policy decisions.
Future work in Karnataka is expected to make further methodological improvements and to expand the scope and include wetlands/coastal/estuarine ecosystems in the analysis. Data requirements for ecosystem accounts are expected to be integrated in the Natural Environment Survey (initiative of the ENVIS division, MoEFCC) so that in the future the approach can be scaled-up to undertake pan-India computations.
The study can be found at the website of the Indian Institute of Science at this link: http://wgbis.ces.iisc.ernet.in/energy/NCAVES/ncaves.html