SDG 6 Indicators Bring Together Ecosystem Accounting and Earth Observation Communities
Collaboration between Earth observation and ecosystem accounting communities
The System of Environmental-Economic Accounting Experimental Ecosystem Accounting (SEEA EEA) has always relied on the Earth observation community. The geospatial component of ecosystem accounts has been made possible by the ease of access and use of spatially explicit data sources, in the form of satellite and aerial images, among others. This collaboration is now being extended to the Sustainable Development Goals (SDGs), in particular for two indicators: 6.3.2: Proportion of bodies of water with good ambient water quality and 6.6.1: Change in the extent of water-related ecosystems over time.
There is a precedent for using satellite data for the SDGs, namely the use of satellite data for indicators 15.1.1: Forest area as a proportion of total land area and 15.3.1: Proportion of land that is degraded over total land area. However, for SDG indicator 6.6.1, collaboration with the Earth observation community was initiated out of a need to measure fresh water ecosystem extent, which covers spatial extent, quality and quantity of freshwater-related ecosystems. UN Environment has partnered with NASA, Google, the European Space Agency (ESA) and the European Commission’s Joint Research Center (JRC) to work on ways to provide countries with Earth observation products that can be used in conjunction with nationally generated data to support monitoring of the indicator.
Harnessing the power of the cloud
A global data product on water body extent at a 30 meter resolution currently exists for use for monitoring SDG 6.6.1, the Global Surface Water Explorer (GSWE). Additionally, global data products on wetlands and water quality (using chlorophyll A and total suspended solids as a proxy) are under development, other aspects of the indicator, including ground water and ecosystem health will be considered.
The GSWE maps the location and temporal distribution of water surfaces at the global scale, providing statistics on the extent and change of those water surfaces. Using Landsat satellites, the GSWE is able to provide 30 m resolution for the entire globe from 1984-2016, with higher spatial and temporal resolutions being provided from 2000 and onwards. To process the immense amount of data generated by such high resolutions, UN Environment has partnered with Google. The computation of GSWE consisted of approximately 3 quadrillion pixels (that’s three thousand trillion, for those who of us who don’t typically deal with quadrillions!), involved 5 million Landsat scenes and required a staggering 2 million plus hours of computation over 66,000 computer processing units. This immense amount of data will be a valuable resource for national statistical offices (NSOs) not only for monitoring indicator 6.6.1, but for the broader compilation of SEEA ecosystem accounts as well.
Work on water quality is also progressing for both indicators. UN Environment is working with NASA on an experimental pilot that uses Earth observation to gather information on the concentration of total suspended solids and chlorophyll A. It is intended that Earth observation data can provide a proxy for the concentration of total suspended solids and chlorophyll through data on the colour of the water. UN Environment and NASA are currently studying water bodies in Zambia, Peru and Senegal and hope to discuss the results of the pilot with these countries soon.
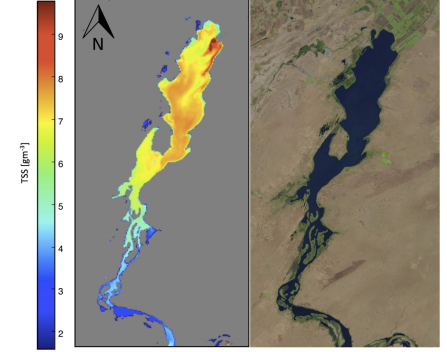
Landsat-derived concentration of Total Suspended Solids, TSS, (left) of Lake Gulers in Senegal. The warmer colors indicate more turbid waters. The highest TSS concentration solids are associated with areas where water flows into the lake from the Senegal River. The true-color image (acquired 21 January , 2014) is shown to the right. Source: https://unstats.un.org/sdgs/files/meetings/iaeg-sdgs-meeting-03/3rd-IAEG-SDGs-presentation-UNEP--6.6.1.pdf
What’s next?
Both indicators were recently upgraded from Tier III to Tier II at the most recent Inter-agency and expert Group-SDGs (IAEG-SDGs) meeting in Vienna, from 9-12 April 2018. This means that the IAEG-SDGs believes that the indicators are conceptually clear and are backed by internationally established methodologies and standards. The next step is to build upon the experience to produce new global data products and to continue building capacity with countries, to makes sure they understand the methodology behind data provided by the GSWE. Country testing of the indicators will take place as part of the work of the SEEA-EEA Technical Committee and Global Working Group on Big Data. In addition, UN Environment is working with Google and the JRC to dig even deeper, by producing statistics at the basin and sub-basin level.